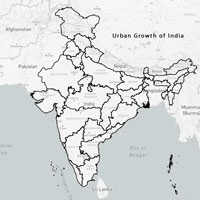
Visualizing Spread of Banks in India (Part 2)
The Government of India is promoting online and digital modes of payments for goods and services. For any person to have access to these facilities it is essential that they have access to banks close to where they live. We at the UXO decided that it would be fun to visualize all the banks on a map of India. This is the second of a set of blog posts in which we shall discuss our results.
We have compiled the dates of establishment of all bank branches in India. The first video animation shows the growth of banks in Mumbai.
We also overlaid the bank data on top of the data of our existing data we had generated about the built up area of Mumbai in 3 time periods (Pre 1990, 1990-2000 and built up between 2000-2010)
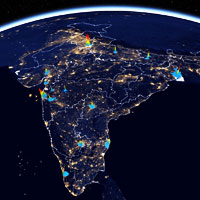
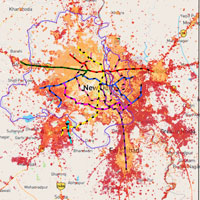
Below is an animation of the growth of all the Banks in India. The data starts with the first bank was established in Calcutta in 1805 and it goes on until 2016. There is a jump of banks in 1900. We think this is just a default value that the RBI uses if it does not know the true date of establishment of a branch. The data also displays the different types of bank branches. We are planning on conducting a detailed study about the growth of banks in different cities of India using a combination of the built up areas as well as locations of banks and the nightly luminosity of these areas.